


Public portal · free self-signup

Brazil's gas market, on a living map.

Official data, refreshed every day, crossed by artificial intelligence — from the molecule in the pipe to the price at the burner tip.
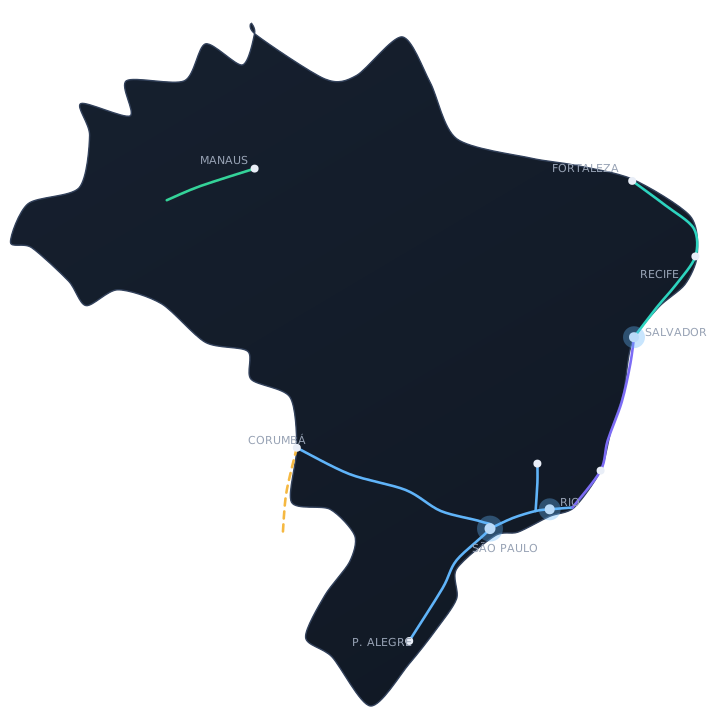
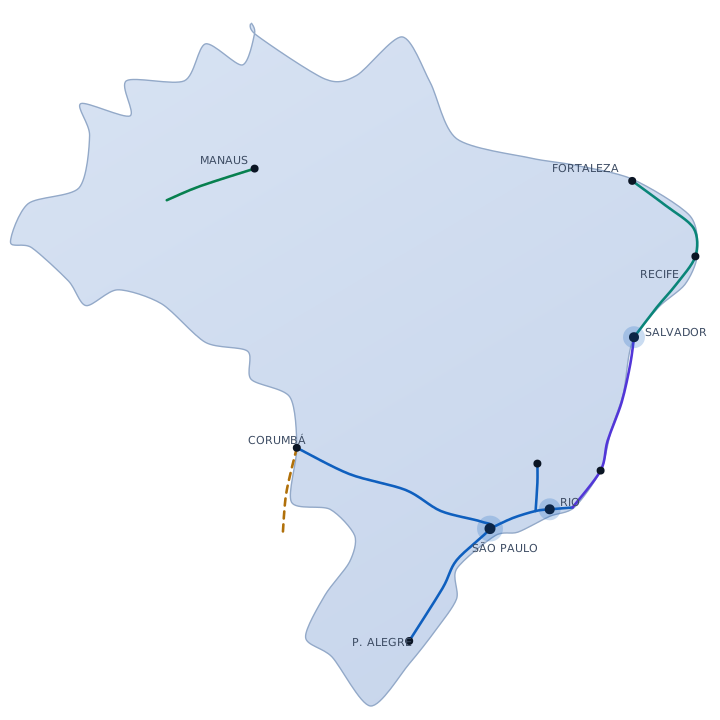
Map of Brazil's gas transport grid
BGx Portal · transport grid Collected today, 10:04
Map of Brazil's natural gas transport grid with the active variables
38.2MM m³/d thermal
BRL 231Spot price SE/CW
41%Reservoir SE/CW
GASBOL · southern stretch
Operator
TBG
Diameter
24"
Idleness
18%
ANP · collected
9,400km of transport grid in Brazil
38Variables in the panel
2xPer day on capacity portals
3Countries on the grid

The experience

Map first. Everything else floats.

The map takes the whole screen. Panels collapse and never compete with the geography. You switch on the variable that matters and it appears where it matters.

Full screen

The map at 100% of the screen, with controlled zoom and a switch between standard and satellite view.

Variable panel

On the left, collapsible, organised into Assets, Operational, Commercial and Intelligence.

Drag and drop

Drop the variable over a region and the portal takes the view to where the data is.

Tooltips with backing

Hover a pipeline and see operator, capacity, diameter, length, stretches and where the figure came from.

Metrics strip

The day's indicators in a floating, movable strip you place wherever it stays out of the way.

Built-in manual

The “?” button explains how to read each variable and how to get value from it — without leaving the map.

60–90s

Mini-Bloo reads the market to you

The Polaris assistant delivers a spoken daily report summarising the day, listened to inside the portal itself. And it answers questions about what is on the screen.

Coverage

What is on the map.

Four groups over the same geography: the physical assets, what operations publish every day, the price benchmarks and the capacity market. Each variable lands on the map with the seal that says where it came from.

Assets

15
  • Pipeline gridC
  • Pipelines under study / authorisedC
  • Entry and exit pointsC
  • City gatesC
  • Compressor stationsC
  • Gas processing unitsC
  • LNG terminalsC
  • DistributorsC
  • ProducersC
  • Gas-fired plants (ANEEL/ONS)C
  • Plants on other fuelsC
  • Reservoirs and river basinsC
  • Biomethane plantsC
  • Concession zonesC
  • Distributor concession areasC

Operational

6
  • Gas-fired thermal dispatchC
  • Reservoir level by subsystemC
  • Spot price / marginal costC
  • Marginal cost DESSEM (24h)C
  • Load and wind forecast D+1–D+7M
  • Grid idlenessD

Commercial

11
  • BrentC
  • WTIC
  • Henry HubC
  • TTFC
  • JKM (proxy)D
  • USD/BRL · official rateC
  • LNG netbackD
  • HH→BR arbitrageD
  • LNG parity vs. domestic priceD
  • Regional spreadsD
  • Buyer vs. seller asymmetryM

Capacity market

6
  • Capacity offers (POC)C
  • GUS processes (PEG)C
  • ANP regulated tariffC
  • Window calendarC
  • Carrier registryC
  • POC announcementsC
C Collected from the official source D Derived by a reproducible calculation M Modelled, with declared confidence

Radical provenance

Every number says where it came from. No black box.

Every variable carries a nature seal, the method, the source and the time of the last collection. That is what stops anyone treating an estimate as a fact.

C

Collected

Straight from the official source, untransformed. ONS, CCEE, ANP, pipeline operators, weather. The portal shows the exact time of collection.

D

Derived

Calculated from collected data, by a deterministic and reproducible method. Anyone can redo the maths and land on the same number.

M

Modelled

It is a projection, and the portal says so plainly. Always with its confidence level — never presented with the same authority as a collected figure.

Freshness on a schedule

Automatic daily collections, twice a day on the capacity market. If a collection fails, the figure is flagged as stale. The portal never fakes freshness.

Official geometry

The grid geometry comes from the official ANP and EPE cartographic files, updated monthly. Nothing is drawn by hand.

Open access

Free self-signup, no commercial barrier. The portal is the public shop window of Polaris intelligence — and the same AI layer answers inside it.

Who it is for

Six readings of the same map.

Marketer and traderIdle capacity, regional spreads, LNG netback and capacity offers in one place — arbitrage and contracting windows before the offer closes.
Pipeline operatorThermal dispatch, reservoir levels and weather that anticipate pipeline packing, with a daily series and history for trend work.
Free consumer and industryThe price drivers — spot, Brent, FX, thermal plants — and the capacity opportunities, to negotiate a contract with symmetric information.
Producer and shipperEntry points, exit zones, approved tariffs and capacity offers from the three operators.
Analyst, consultancy and pressA single, public and auditable source, with provenance and update date declared on every variable.
Regulator and academiaTransparent access to the physical grid and the operational variables, with open methodology.

Create your free account and switch on the layers that matter.

No install, no spreadsheet, no middlemen. You sign in, see the whole grid and switch on the variables your business runs on.